

How to Use Heikin Ashi Charts in 0DTE Options Trading
What Are Heikin Ashi Candles?
Heikin Ashi (Japanese for "average bar") candles are a modified form of candlestick that smooths price action by averaging data from the current and previous bars. Instead of plotting the raw open, high, low, and close, each Heikin Ashi bar is calculated:
- HA Close = (Open + High + Low + Close) / 4 — the average price of the current bar
- HA Open = (previous HA Open + previous HA Close) / 2 — anchored to the prior bar's midpoint
- HA High = the highest of the actual high, HA Open, and HA Close
- HA Low = the lowest of the actual low, HA Open, and HA Close
Because each bar inherits half of its open from the previous bar, Heikin Ashi charts chain bars together into smooth, continuous runs of color. The result: trends appear as long unbroken streaks of green or red, and the one-bar noise that litters a traditional candlestick chart largely disappears.
How Are Heikin Ashi Candles Different From Traditional Candlesticks?
The short answer: traditional candles show you every tick of truth, Heikin Ashi shows you the trend. Each has a job.
| Traditional Candlestick | Heikin Ashi | |
|---|---|---|
| Prices shown | Actual open/high/low/close | Averaged, synthetic values |
| Appearance in a trend | Mixed green and red bars | Long single-color streaks |
| Noise level | High — every fluctuation visible | Low — minor counter-moves absorbed |
| Best for | Precise entries, exits, levels | Trend identification, staying in winners |
| Signal speed | Immediate | Slightly delayed (one bar or so) |
| Reading fills/stops | Reliable — prices are real | Unreliable — HA prices are not tradeable prices |
A useful mental model: candlesticks answer "what exactly did price do?" while Heikin Ashi answers "which side is actually in control?"
Why Does Noise Filtering Matter So Much in 0DTE Trading?
Because 0DTE option premiums are violently noisy, and noise is what shakes traders out of good trades. A 0DTE contract's price is driven by gamma — small moves in the underlying produce large percentage swings in the premium. On a traditional 1-minute or 5-minute candlestick chart of an option contract, even a strong trend day prints constant counter-color bars: a -15% red candle inside a move that ultimately runs +300%.
Those counter-color bars trigger two classic 0DTE mistakes:
- Selling winners too early. One sharp red candle convinces you the move is over, and you exit a trade that had hours of trend left.
- Overtrading chop. Raw candles make every wiggle look like a new signal, pulling you into low-quality entries that theta decay punishes.
Heikin Ashi addresses both. By averaging each bar and anchoring it to the previous one, HA absorbs the routine 1-2 bar pullbacks that occur inside every trend. When the streak of green keeps printing, you have a visual reason to stay in the trade. When the color genuinely flips, something real changed.
What Does a 5-Minute Color Flip on an Option Chart Mean?
A Heikin Ashi color flip on a 5-minute option chart — a green bar printing after a run of red, or red after a run of green — is frequently an early indication that momentum in the contract is changing. It is not a guarantee of reversal, but it is one of the cleanest single-glance warnings available intraday.
Here is a real example. On June 9, 2026, QQQ sold off 1.8% and the 720 put — a few dollars out of the money at the open — ran from $1.70 to a $32.62 high, a 19x move. The same contract, same day, same 5-minute bars, charted both ways:
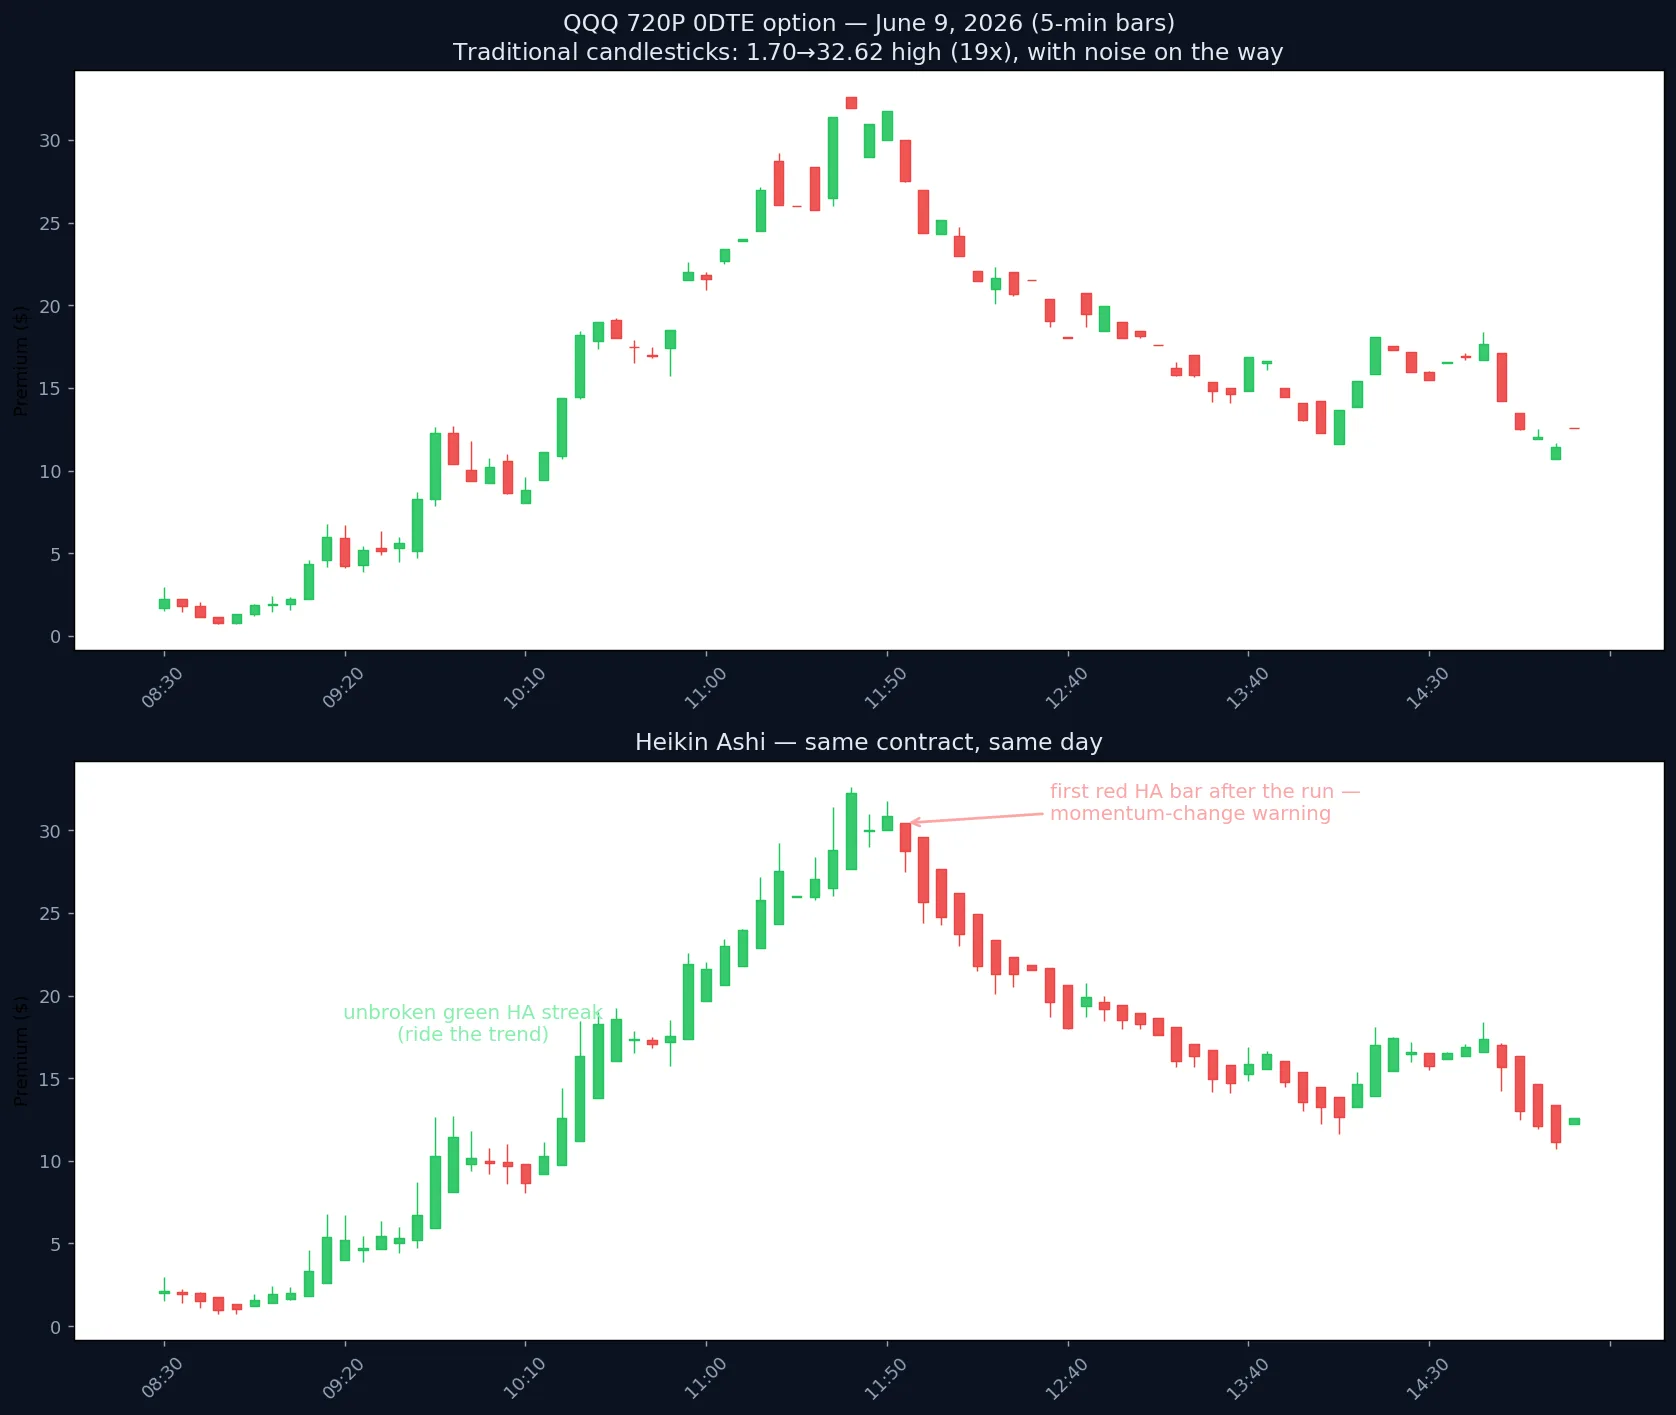
Look at the difference. The candlestick chart (top) prints counter-color red bars all the way up the move — any one of them could have scared a trader out of a position that still had a triple-digit run ahead. The Heikin Ashi chart (bottom) shows the same climb as two long green streaks, including an unbroken 13-bar run straight into the peak — and the first red bar appears right at the top, within a bar or two of the contract's $32 high, exactly where reducing or exiting was the correct decision. What followed proved the signal: ten consecutive red HA bars as the premium gave back half its value.
Not Every Opposite-Color Bar Is a Reversal
An important nuance, visible in the chart above: a small Heikin Ashi bar of the opposite color appearing inside a strong trend often does not mean reversal — the trend is just taking a breath. Notice the small red HA bars during the morning climb (the brief cluster around 10:10, and a single red bar near 10:50). Each was small-bodied with little range and no follow-through, immediately giving way to a fresh green streak — pauses, not turns. A trader who exited on those breathers missed the second 13-bar green run that carried the contract to its high.
What separates a breather from a genuine momentum-change warning:
- Breather: one (occasionally two) small-bodied opposite-color bar, short total range, no follow-through — the next bar resumes the trend color. Hold.
- Warning: the flip bar (or the bars right after it) prints a tall body in the new color, range expands, and follow-through continues in the new direction — like the run of large red bars off the $36 top in the chart above. Reduce or exit.
Context sharpens the read further: a small red bar after a steady grind is routine, but the same bar appearing immediately after a parabolic stretch or at a key level deserves more respect. When in doubt, let one more bar print — with Heikin Ashi you are trading the streak, not the single bar.
The logic: because each HA bar averages in the prior bar, a single flip can only happen when recent price action has shifted enough to overcome the smoothing. Random noise rarely flips an established HA streak — a genuine change in the balance of buying and selling usually does.
Practical ways 0DTE traders use the 5-minute flip:
- Exit warning on a winner. You are long calls that have run all morning on an unbroken green streak. The first red HA bar after that streak is your cue to tighten the stop, scale partial profits, or exit entirely — especially if it appears near a key level or after a parabolic stretch.
- Confirmation for an entry. A flip in the direction of the prevailing trend after a brief counter-color pause (a two- to three-bar pullback) often marks the resumption of the move — a lower-risk continuation entry than chasing the initial breakout.
- Stay-out signal. Frequent back-and-forth flips on the 5-minute chart mean the contract is chopping. For a 0DTE long premium trade, chop is the enemy: theta bleeds while direction goes nowhere. Repeated flips are a sit-on-hands signal.
Strengthen the signal by reading the bars around the flip. In a healthy trend, HA bars are tall-bodied with little or no wick against the trend (green bars with no lower wicks in an uptrend). When bodies shrink and counter-trend wicks grow before the flip, momentum is already fading — the flip then confirms what the bar anatomy was hinting.
Should You Read Heikin Ashi on the Option Chart or the Stock Chart?
Both, and they answer different questions. The stock (underlying) chart tells you about the directional trend you are betting on. The option chart tells you about the premium you actually own — which moves with delta, gamma, theta, and implied volatility, not just direction.
The two can disagree in informative ways. Late in the day, an underlying can grind slowly upward while a call's premium flattens or bleeds because theta decay outruns the small delta gains. The stock chart still looks green; the option's HA chart flips red. For a 0DTE trader holding that contract, the option chart is telling the truth that matters: your position has stopped making money.
A practical workflow many 0DTE traders settle into:
- Use the stock chart (with regime and timeframe-alignment context) to choose direction and timing.
- Use the option chart in Heikin Ashi mode to manage the position — ride the streak, respect the flip.
What Are the Limitations of Heikin Ashi?
Heikin Ashi trades immediacy for clarity, and you need to respect three costs:
- Lag. The averaging that filters noise also delays signals by roughly a bar. On a 5-minute chart, that means a flip may print 5-10 minutes after the actual turn. For 0DTE positions, this is usually an acceptable price for avoiding dozens of false alarms — but it means HA is a confirmation tool, not a tick-perfect timing tool.
- HA prices are not real prices. The open and close of an HA bar are synthetic averages. Never place a limit order, set a stop, or calculate a risk level off an HA bar's values. Check the real bid/ask or switch to traditional candles for execution decisions.
- Chop produces whipsaws. In a range-bound session, HA flips repeatedly and every flip looks like a signal. HA shines in trending conditions and degrades in sideways ones — which is why pairing it with a regime filter matters. If the market regime is neutral and timeframes are unaligned, no chart style makes directional 0DTE trades a good idea.
How Do You Combine Heikin Ashi With Other Signals?
Heikin Ashi works best as the visual layer on top of an existing process, not as a standalone system. The combinations that earn their keep in 0DTE trading:
- Regime first, HA second. Check the multi-timeframe regime score before trusting any HA streak. A green HA run aligned with a bullish regime across timeframes is a high-conviction hold; the same streak inside a neutral or conflicting regime deserves smaller size and faster exits.
- EMAs on the HA chart. A 9/14/26 EMA stack overlaid on HA bars adds structure: streaks that ride above a rising EMA stack are the trends worth holding, and a color flip that coincides with a loss of the 9 EMA is a stronger exit signal than either alone.
- Volume. A flip on expanding volume means conviction behind the turn. A flip on thin volume — especially around lunchtime — is more likely noise that survived the averaging.
How to Use Heikin Ashi on My 0DTE Options
On the My 0DTE Options platform, Heikin Ashi mode is available on both the stock chart and the option chart for Gold plan members. The option chart defaults to HA mode with 5-minute bars — the configuration this article describes — and you can toggle between Heikin Ashi and traditional candlesticks at any time (Shift+Space on desktop). The option chart's strike selector, Call/Put toggle, and multi-day views all work identically in either mode.
A sensible way to start: pull up a recent strong trend day on a ticker like SPY or NVDA, set the option chart to 5-minute HA, and study how the winning contract's chart behaved — how long the streak ran, what the bars looked like as momentum faded, and where the flip printed relative to the high. Then compare the same day in traditional candles. The difference in readability is the entire argument for Heikin Ashi.
For the regime framework that pairs with HA, read how to read market regime for 0DTE trading. For the risk that makes premium charts so violent in the first place, see gamma risk in 0DTE options.
Ready to trade smarter?
Start using real-time market regime analysis and composite scores to find high-conviction 0DTE setups.
7-day free trial · Cancel anytime · Free accounts include daily regime scores for every ticker